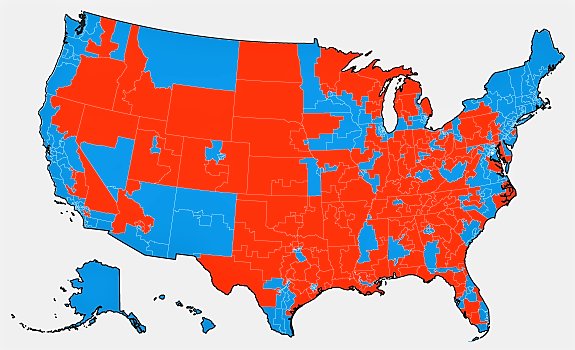
Imagine if only one group of Americans cast their ballots in this election. You might not believe the differences on the electoral map.
Geoffrey Skelley at FiveThirtyEight just completed a fantastic study that focused on women, men, nonwhite voters and white voters by education level.
Without getting too far down in the weeds, Skelley looked at generic ballot polls from October and calculated how much a group leaned toward one party, on average.
From that mix, he concluded women overall were 8 points to the left of the nation.
So, if only women could vote on Tuesday the electoral map would look something like this:
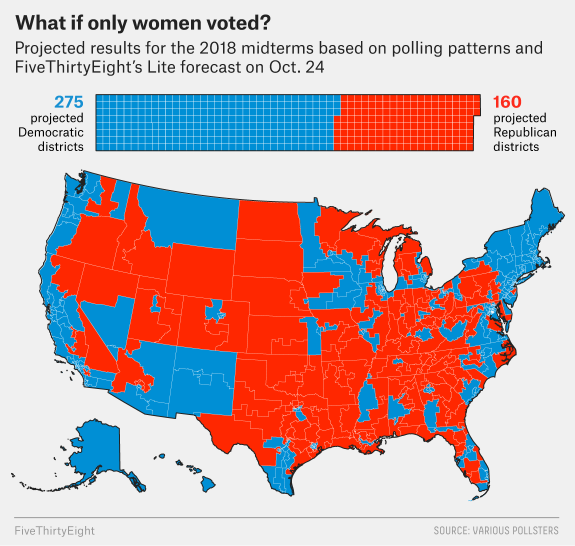
A women-only electorate would give Democrats a huge House majority: The adjusted vote share estimates suggest that women would elect 275 Democrats to just 160 Republicans, which is 44 more Democratic seats than the 231 projected Wednesday by FiveThirtyEight.
To put that in perspective, the last time either party won more than 270 seats was in 1978, when the Democrats won 278.
Now, what if only men voted?
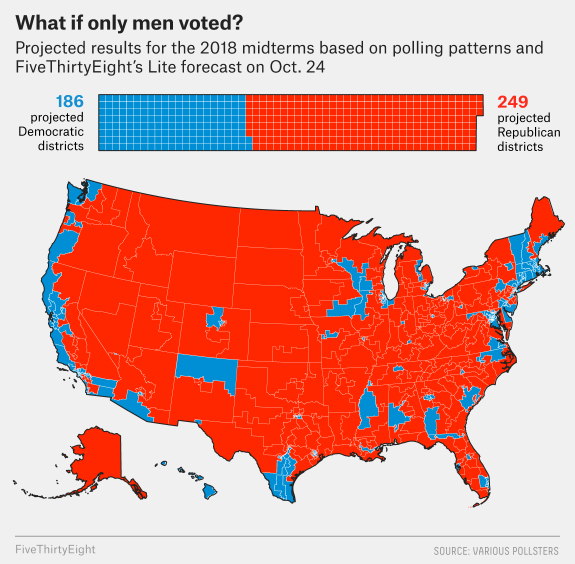
Men are about 11 points more Republican than the country, and as such, they would elect a 249-to-186 Republican majority.
Here’s what the map looks like side-by-side:
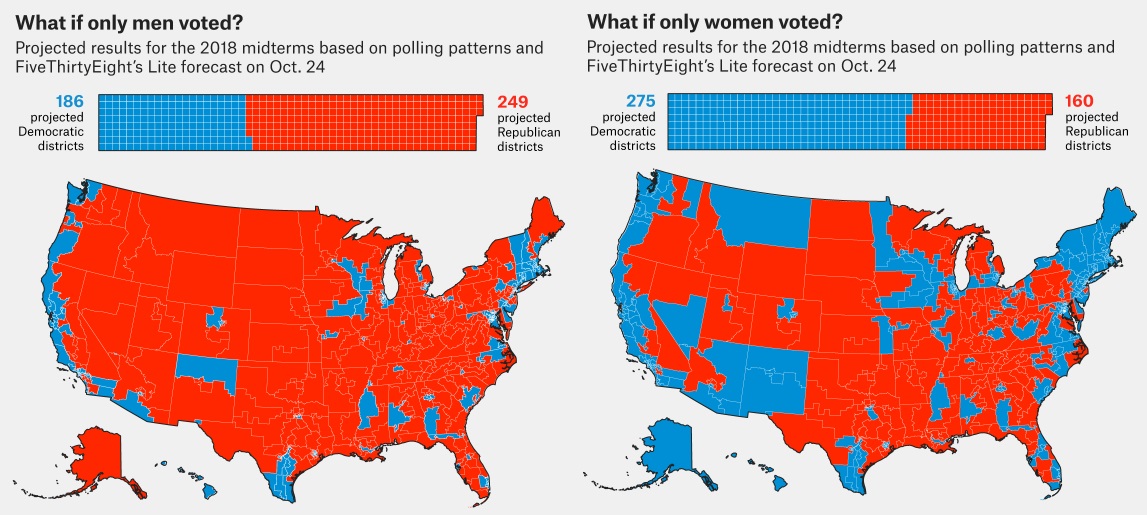
Two very different America’s represented in Washington, D.C.
EDUCATION LEVELS
The 2016 presidential election saw wild differences between white voters based on their education levels.
College-educated whites shifted toward the Democrats, and whites without a college degree moved further into the GOP camp.

White college voters would elect a 233-to-202 Democratic majority, which isn’t all that different from the FiveThirtyEight forecast: a 231-to-204 Democratic majority.
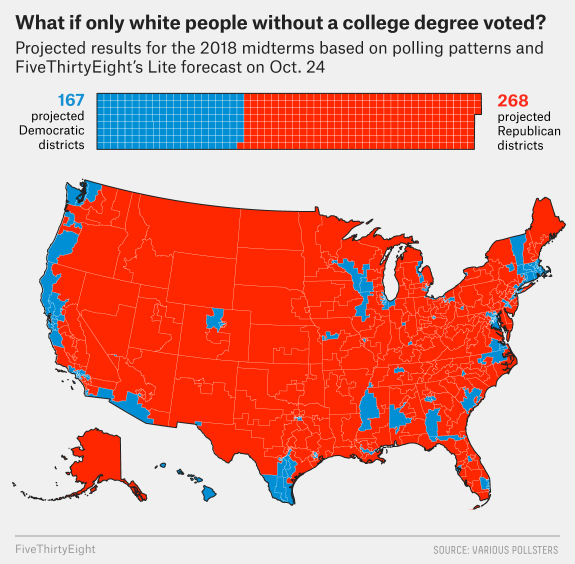
If we look at white voters without a college degree, their party preference was even more pronounced than college-educated whites.
They were 27 points more Republican than the nation as a whole.
And as you can see in the map above, if only they were to vote, the country would be almost entirely red outside of big cities.
Non-college whites would elect a 268-to-167 Republican majority, but the GOP majority might be even larger than that.
Some heavily Democratic districts, particularly in the South, would also elect Republicans. Remember, Trump won 70 percent of the white vote in South Carolina.
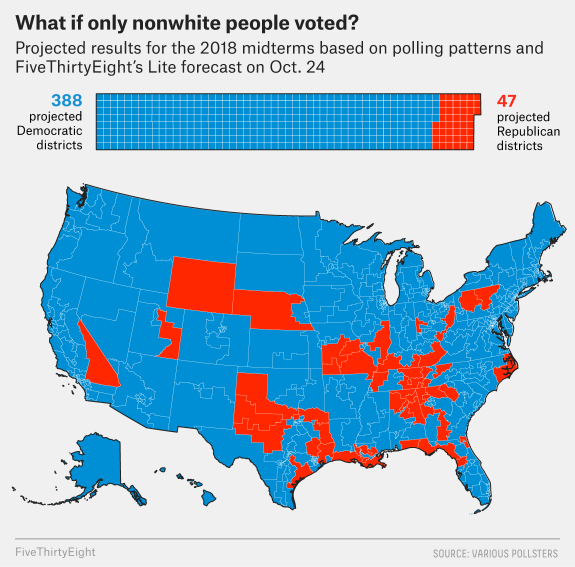
If only nonwhite Americans could cast ballots, they would elect a gigantic Democratic majority (the largest projected majority out of any group looked at).
While white voters on the whole are Republican-leaning (Trump won them by about 15 to 20 percentage points in 2016), nonwhite voters are strongly Democratic (Hillary Clinton won them by more than 50 points).
Look at America side-by-side between non-college educated white voters, and nonwhites:
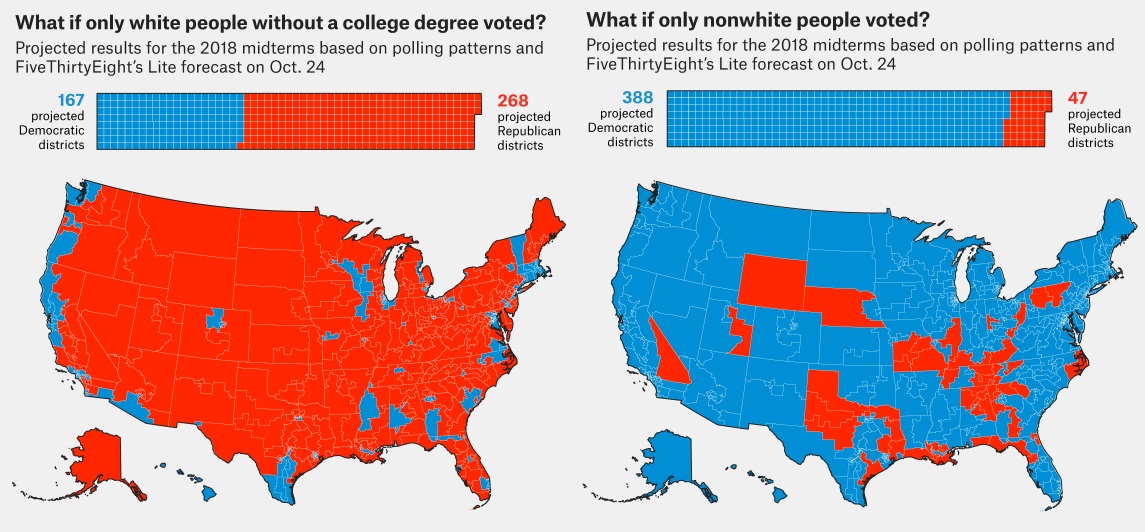
That map explains best where we are as a country: Deeply divided.